Ballinger and Bruckner, LLP
Every Ballinger and Bruckner, LLP app we track, ranked by estimated monthly revenue — portfolio-level reach and per-app estimates from live App Store signals.
| Apps tracked | 7 |
|---|---|
| Est. portfolio revenue / mo | ~$28k |
| Est. portfolio downloads / mo | ~2k |
| Total ratings | 61 |
| Data updated | 17.06.2026 |


Downloads / mo · WW
1k–5k
Revenue / mo · WW
$14k–$57k
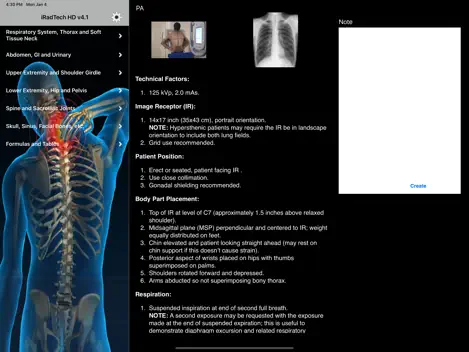
★4.6(52)Released 29.12.2009


Downloads / mo · WW
2–9
Revenue / mo · WW
$3–$20
★3.3(4)Released 29.02.2012


Downloads / mo · WW
2–9
Revenue / mo · WW
$0
★5.0(4)Released 19.01.2010


Downloads / mo · WW
1–2
Revenue / mo · WW
$0
★1.0(1)Released 13.09.2013


Downloads / mo · WW
0
Revenue / mo · WW
$0
★0.0(0)Released 02.10.2012


Downloads / mo · WW
0
Revenue / mo · WW
$0
★0.0(0)Released 02.10.2012


Downloads / mo · WW
0
Revenue / mo · WW
$0
★0.0(0)Released 20.04.2023