
Pay Chart generates an estimated $0/month in revenue from 0 downloads/month on the App Store, according to AppCurrents estimates (updated 2026-08-02).
| Est. revenue / month | $0 |
|---|---|
| Est. downloads / month | 0 |
| Estimate confidence | low |
| Pricing | Free + IAP |
| Rating | 0.00 ★ (0 ratings) |
| Category | Finance |
| Released | 21.04.2018 |
| App last updated | 16.09.2025 |
| Platform | iOS |
Modeled monthly estimate · rating velocity · low confidence
About
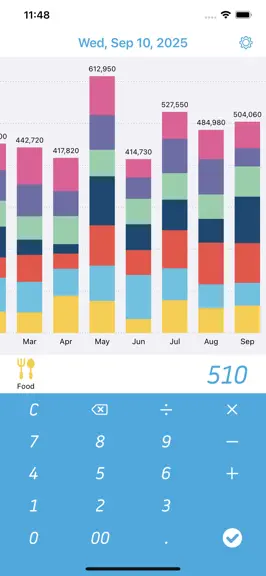
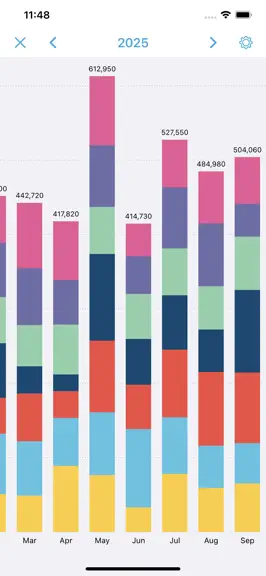
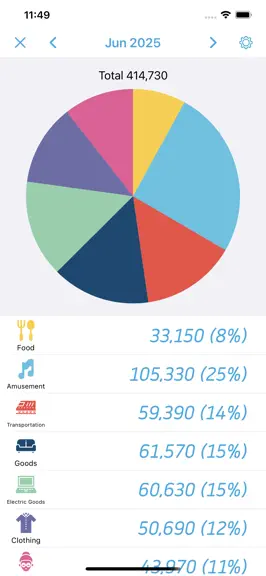
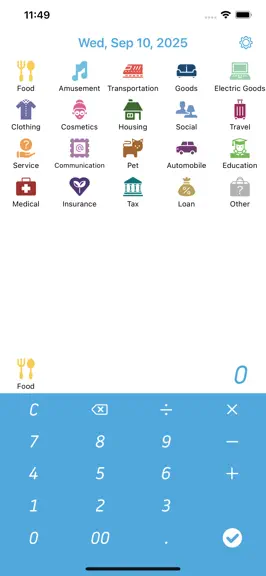
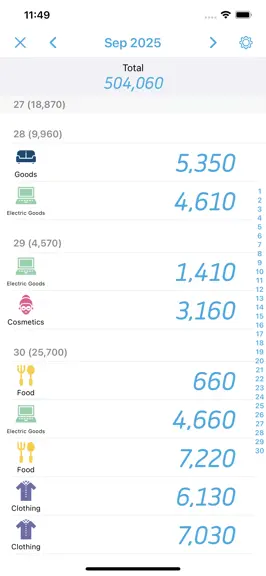
This household budgeting app keeps track of your daily expenses. The input screen includes a graph showing the ratio of your expenses every month, so you can tell at a glance when you're spending too much. - Divides up your expenses by category. - Can sync data with multiple devices, including iCloud, iPhone, and iPad. (Syncing may take time.) - Enter expenses from your Apple Watch. (Syncing with…
Trends & analysis
Chart rank trend
US · overallWhy it's surfacing
Scout 4Ratings & velocity
★ 0 in windowGeographic reach
best rank · 0 storefrontsRevenue & downloads trend
monthly estimateIn-app purchases
1 tiersUpdate history
1 update tracked- v1.1410mo ago
- Supported iOS 26. - Changed supported OS to iOS 26 and WatchOS 26 or higher.
Pay Chart — FAQ
How many downloads does Pay Chart get?
Pay Chart sees an estimated 0 downloads per month on the App Store, per AppCurrents modeling.
Is Pay Chart free?
Pay Chart is free to download on the App Store, monetizing through in-app purchases.
When was Pay Chart released?
Pay Chart launched on the App Store on 21.04.2018. Its latest version shipped 16.09.2025.
Apps like Pay Chart
See all alternatives → Experian®Finance · $290k–$1.6M/mo
 Credit Sesame: Grow Your ScoreFinance · $260k–$1.4M/mo
 Rocket Money - Bills & BudgetsFinance · $200k–$1.2M/mo
 TradingView: Track All MarketsFinance · $150k–$800k/mo
 MileIQ: Mileage Tracker & LogFinance · $120k–$680k/mo
 Monarch: Budget & Track MoneyFinance · $110k–$630k/mo