
Vernier Graphical Analysis
Vernier Software & Technology
App Store·EducationFree★ 2.07 (548)launched 7.8y agoupdated 9mo ago
Scout Score
9
Est. downloads / mo
200–1k
Est. revenue / mo
$0
Review velocity / day
0
Chart velocity
—
Peak rank
—
Days tracked
—
Modeled monthly estimate · medium confidence
About
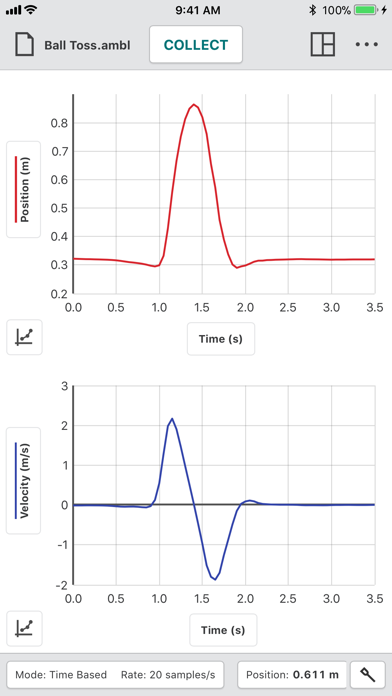
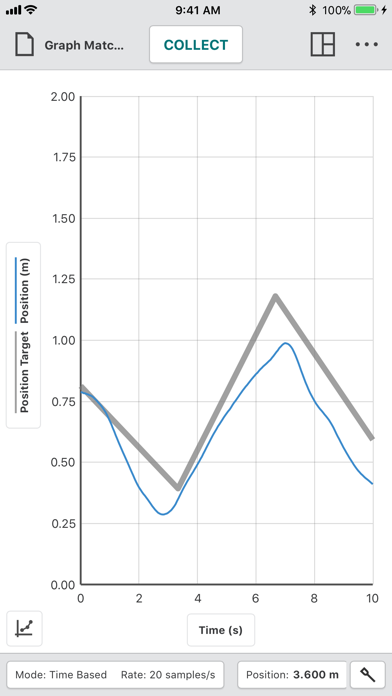
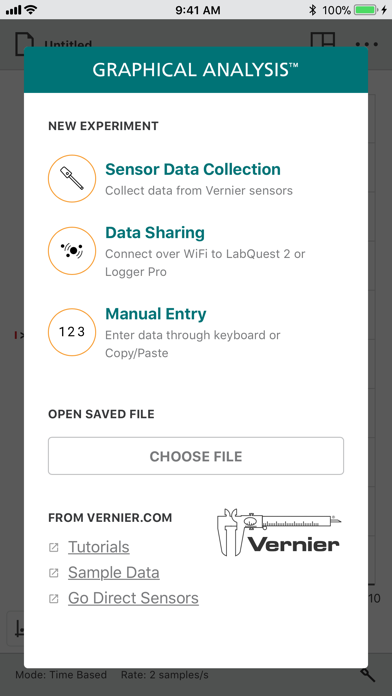
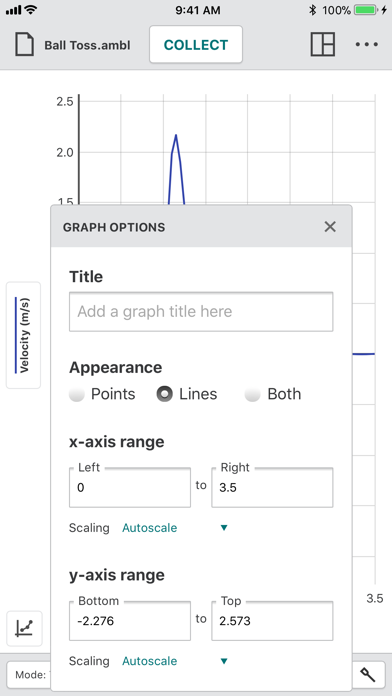
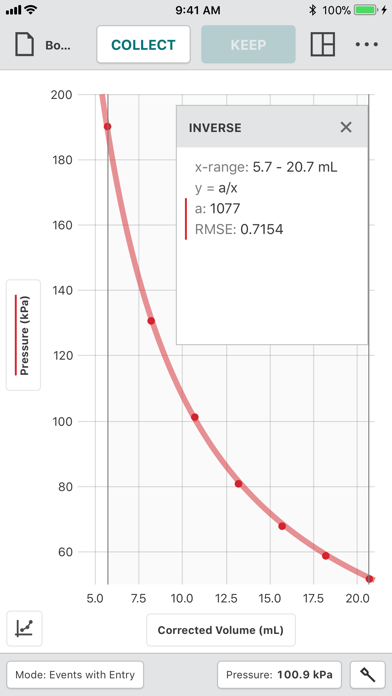
Graphical Analysis™ is a tool for science students to collect, graph, and analyze data from Vernier sensors. Sensor data-collection support: • Vernier Go Direct® sensors - with Bluetooth® wireless technology • Vernier Go Wireless® Heart Rate and Go Wireless Exercise Heart Rate monitors • Vernier LabQuest® sensors used with a LabQuest Stream interface Additional experiment options: • Data Sharing…
Trends & analysis
Chart rank trend
US · overallCollecting rank history — no snapshots so far. Fills in twice daily.
Why it's surfacing
Scout 9Newness
3
Breakout
0
Reviews & velocity
Total ratings
548
Jun 6
New ratings / day
Collecting history — no snapshots so far. Fills in twice daily.
Rating distribution
26% positive · 548 ratings5★
23%
4★
3%
3★
2%
2★
3%
1★
70%
Geographic reach
best rank · 0 storefrontsCollecting storefront coverage — no snapshots so far. Fills in twice daily.
Revenue & downloads trend
ARPU $0Est. revenue / mo · $0
$0
Jun 6Jun 8
Est. downloads / mo · 588
588
Jun 6Jun 8
Apps like Vernier Graphical Analysis
See all alternatives → Duolingo: Language LessonsEducation · $24M–$97M/mo
 PictureThis - Plant IdentifierEducation · $23M–$96M/mo
 Simply Piano: Learn Piano FastEducation · $2.6M–$11M/mo
 Gauth: AI Study CompanionEducation · $2.5M–$11M/mo
 Early Learning AcademyEducation · $1.8M–$7.4M/mo
 Babbel - Language LearningEducation · $1.8M–$7.4M/mo