
Vernier Graphical Analysis GW
Vernier Graphical Analysis GW generates an estimated $0/month in revenue from 80–400 downloads/month on the App Store, according to AppCurrents estimates (updated 2026-08-02).
| Est. revenue / month | $0 |
|---|---|
| Est. downloads / month | 80–400 |
| Estimate confidence | medium |
| Pricing | Free |
| Rating | 2.43 ★ (158 ratings) |
| Category | Education |
| Released | 06.05.2012 |
| App last updated | 27.11.2019 |
| Platform | iOS |
Modeled monthly estimate · rating velocity · medium confidence
About
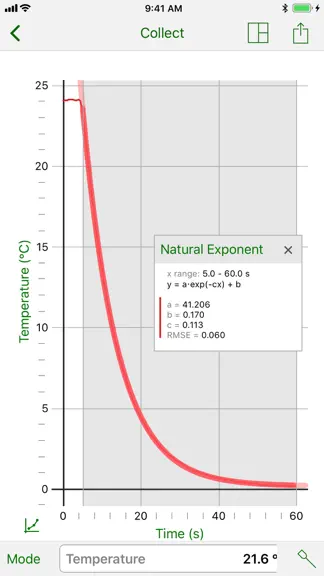
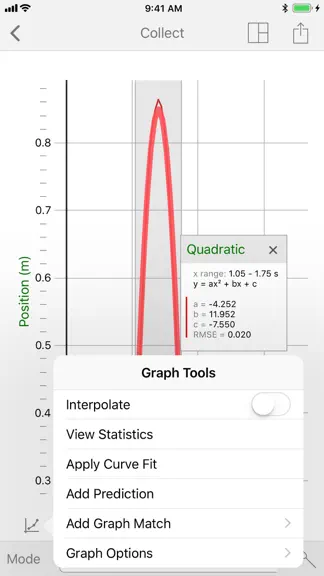
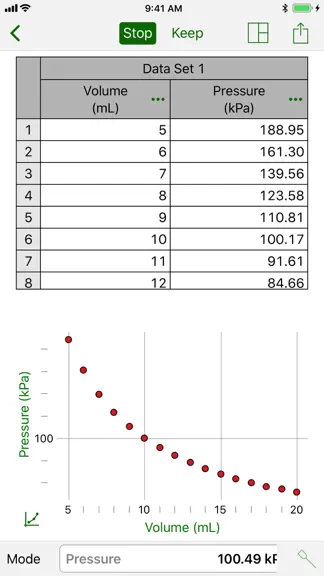
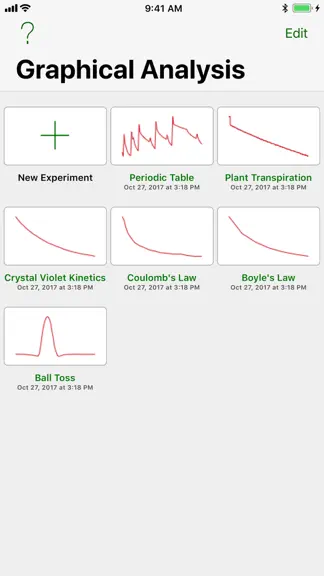
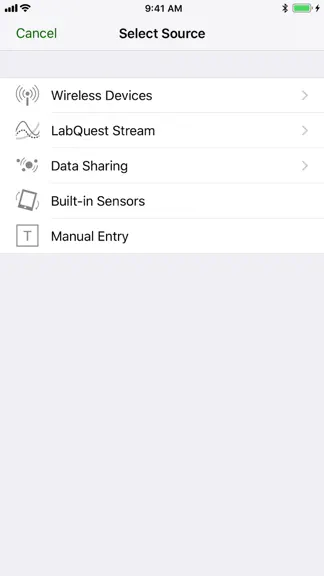
Graphical Analysis™ GW is a tool for science students to collect, graph, and analyze data from Vernier Go Wireless® sensors. Sensor data-collection support: • Vernier Go Wireless® Temp and Go Wireless pH sensors • Vernier Go Wireless Heart Rate and Go Wireless Exercise Heart Rate monitors • Vernier LabQuest® sensors used with Go Wireless Link or LabQuest Stream interfaces • Basic support for some…
Trends & analysis
Chart rank trend
US · overallWhy it's surfacing
Scout 8Ratings & velocity
★ 0 in windowRating distribution
34% positive · 158 ratingsGeographic reach
best rank · 0 storefrontsRevenue & downloads trend
ARPU $0Update history
1 update tracked- v4.0.66.7y ago
• Support for iOS 13 • Various bug fixes and improvements
Vernier Graphical Analysis GW — FAQ
How many downloads does Vernier Graphical Analysis GW get?
Vernier Graphical Analysis GW sees an estimated 80–400 downloads per month on the App Store, per AppCurrents modeling.
Is Vernier Graphical Analysis GW free?
Vernier Graphical Analysis GW is free to download on the App Store, with no in-app purchases detected.
What is Vernier Graphical Analysis GW's rating?
Vernier Graphical Analysis GW holds a 2.43-star average from 158 ratings on the App Store.
When was Vernier Graphical Analysis GW released?
Vernier Graphical Analysis GW launched on the App Store on 06.05.2012. Its latest version shipped 27.11.2019.


