
Stock Analysis: Stocks & Funds
Stock Analysis: Stocks & Funds generates an estimated $10k–$58k/month in revenue from 24k–97k downloads/month on the App Store, according to AppCurrents estimates (updated 2026-09-14).
| Est. revenue / month | $10k–$58k |
|---|---|
| Est. downloads / month | 24k–97k |
| Estimate confidence | medium |
| Pricing | Free + IAP |
| Rating | 4.89 ★ (6,474 ratings) |
| Category | Finance |
| Best chart rank | #84 Finance Grossing |
| Released | 05.12.2025 |
| App last updated | 05.09.2026 |
| Platform | iOS |
Modeled monthly estimate · rating velocity · medium confidence
About
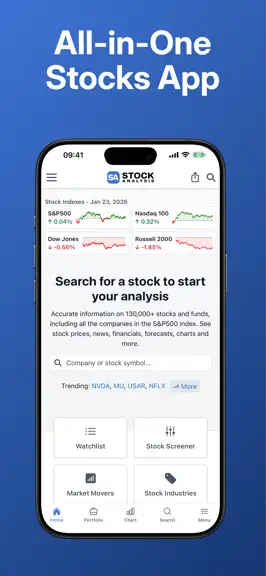
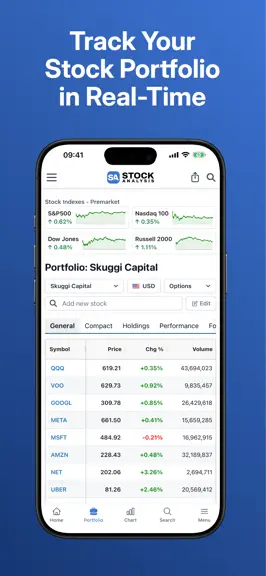
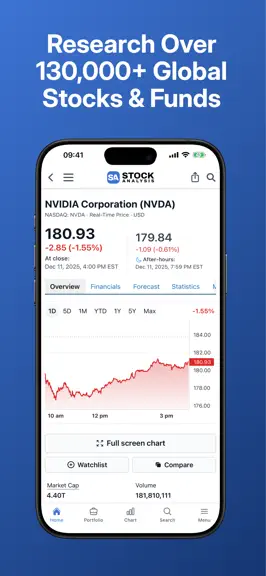
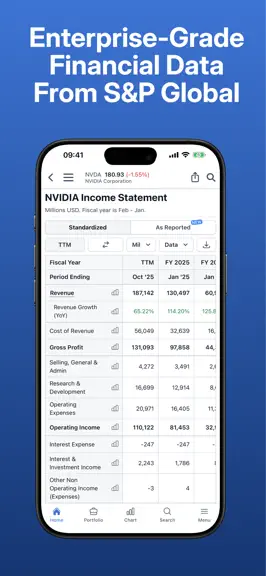
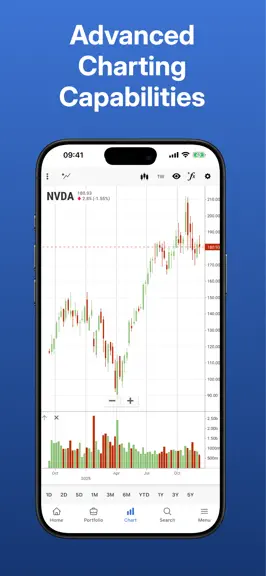
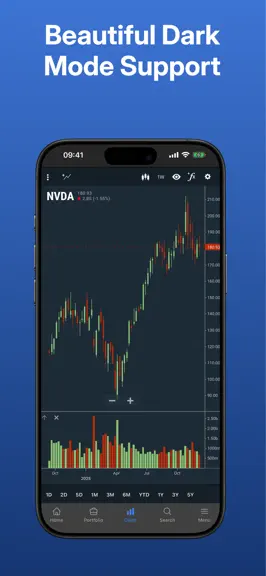
Stock Analysis is the best all-in-one stocks app for regular investors. Use our free app to research stocks, funds and keep track of of your portfolio, all in one place. We have global coverage, with over 130,000 stocks and funds that span all of the world’s countries, stock markets and exchanges. Our data updates in real-time, including pre-market and after-hours quotes, with both basic charts…
Trends & analysis
Chart rank trend
US · categoryWhy it's surfacing
Scout 26Ratings & velocity
★ 0 in windowRating distribution
99% positive · 4k ratingsGeographic reach
best rank · 1 storefrontRevenue & downloads trend
ARPU $1In-app purchases
4 tiersUpdate history
12+ updates tracked- v1.3.59d ago
This release includes new features, bug fixes, and improvements: • IPO lockup expiration calendar. • Faster app launch. • iOS broker connect opens the login browser again. • Chart no longer stuck on a blank loader or dead range buttons. • Offline shows connection issue instead of a crash. • Other bugs and improvements.
- v1.3.414d ago
This release includes new features, bug fixes, and improvements: • New Save icon next to each view in the Views dropdown of our technical charts. • Other bug fixes and improvements.
- v1.3.318d ago
This release includes new features, bug fixes, and improvements: • New dedicated Filings page with an inline PDF viewer. • Most Alerted tab on the Trending page. • Other bug fixes and improvements.
- v1.3.122d ago
This release includes bug fixes and improvements: • Change default technical chart type to Candlestick • Improved reliability and various bug fixes
- v1.3.025d ago
This release includes new features, bug fixes and improvements: • Follow analysts and get new rating alerts. • New Latest Ratings page for analysts you follow. • Market heatmaps update live with more indexes. • Various bug fixes, improvements and new data points.
Stock Analysis: Stocks & Funds — FAQ
How much money does Stock Analysis: Stocks & Funds make?
According to AppCurrents estimates, Stock Analysis: Stocks & Funds generates approximately $10k–$58k per month (medium confidence), modeled from its the App Store chart performance, rating velocity, and monetization signals.
How many downloads does Stock Analysis: Stocks & Funds get?
Stock Analysis: Stocks & Funds sees an estimated 24k–97k downloads per month on the App Store, per AppCurrents modeling.
Is Stock Analysis: Stocks & Funds free?
Stock Analysis: Stocks & Funds is free to download on the App Store, monetizing through in-app purchases.
What is Stock Analysis: Stocks & Funds's rating?
Stock Analysis: Stocks & Funds holds a 4.89-star average from 6,474 ratings on the App Store. It currently ranks #84 on the Finance grossing chart.
When was Stock Analysis: Stocks & Funds released?
Stock Analysis: Stocks & Funds launched on the App Store on 05.12.2025. Its latest version shipped 05.09.2026.
Apps like Stock Analysis: Stocks & Funds
See all alternatives → Experian®Finance · $300k–$1.7M/mo
 Credit Sesame: Grow Your ScoreFinance · $260k–$1.4M/mo
 Rocket Money - Bills & BudgetsFinance · $160k–$880k/mo
 TradingView: Track All MarketsFinance · $140k–$770k/mo
 MileIQ: Mileage Tracker & LogFinance · $120k–$680k/mo
 Lenme: Borrowing and LendingFinance · $100k–$580k/mo