
SPL Graph generates an estimated $6–$90/month in revenue from 2–6 downloads/month on the App Store, according to AppCurrents estimates (updated 2026-10-02).
| Est. revenue / month | $6–$90 |
|---|---|
| Est. downloads / month | 2–6 |
| Estimate confidence | medium |
| Pricing | Paid $9.99 |
| Rating | 3.67 ★ (3 ratings) |
| Category | Music |
| Released | 27.03.2009 |
| App last updated | 16.09.2026 |
| Platform | iOS |
Modeled monthly estimate · rating velocity · medium confidence
About
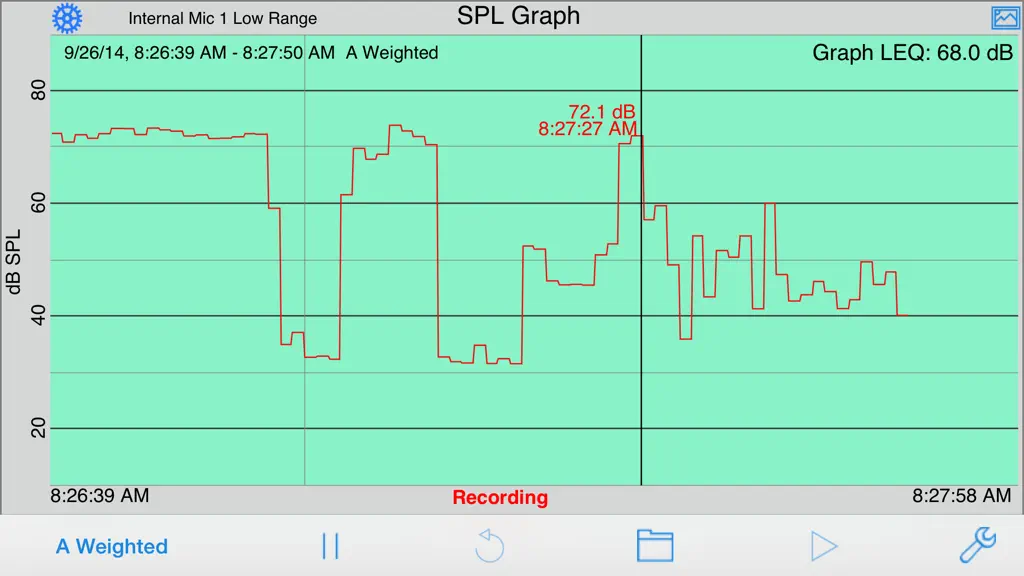
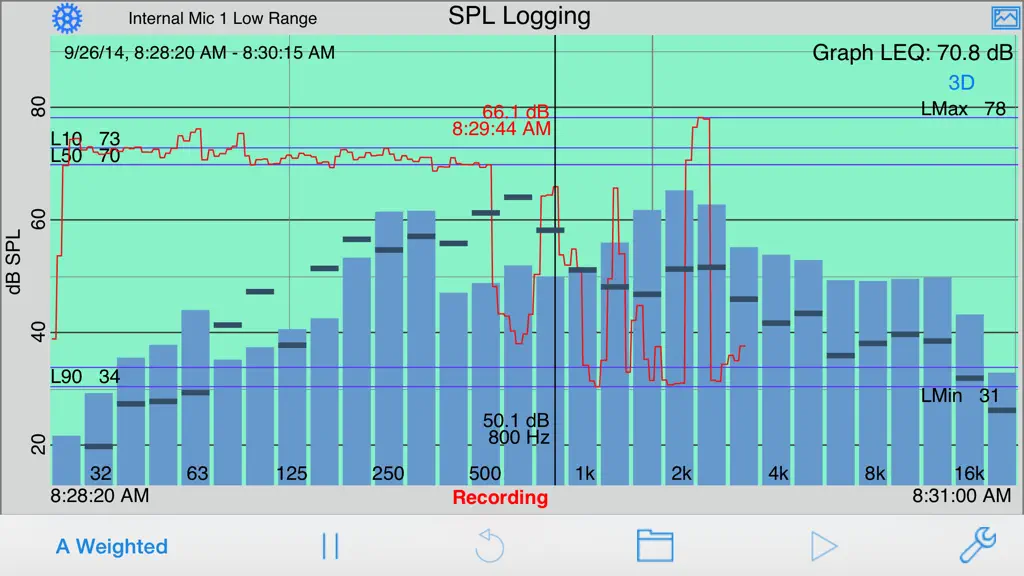
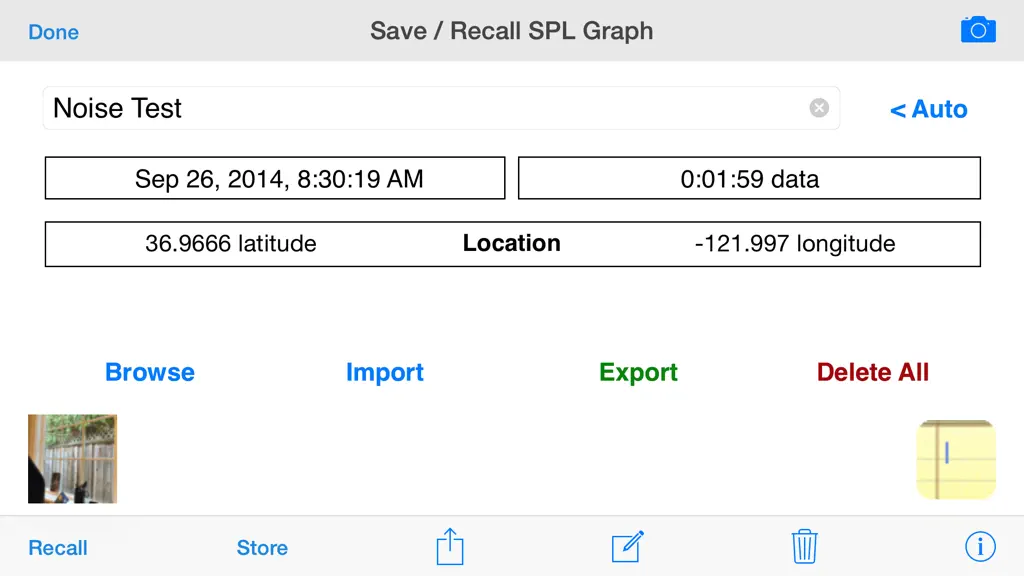
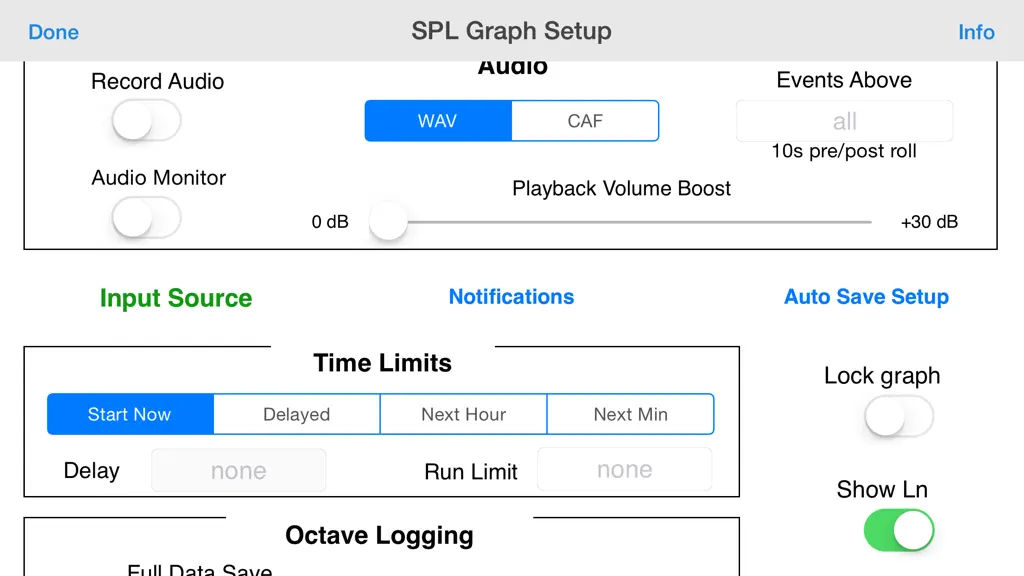
SPL Graph is an audio Sound Pressure Level (SPL) environmental noise analyzer, real-time frequency analyzer, chart recorder and data logger. It includes: * Plot sound level over time * Record audio while plot is running, playback to identify sounds that may have caused problems * Capture video of events (optional in-app purchase) * Do octave and 1/3 octave band analysis (optional in-app purchase)…
Trends & analysis
Chart rank trend
US · overallWhy it's surfacing
Scout 12Ratings & velocity
★ 0 in windowRating distribution
67% positive · 3 ratingsGeographic reach
best rank · 0 storefrontsRevenue & downloads trend
ARPU $8In-app purchases
5 tiersUpdate history
3 updates tracked- v9.216d ago
-Bug fixes and stability improvements -Support for latest iOS versions
- v9.11mo ago
-Fixed GPS coordinates not appearing in saved files -Increased GPS coordinates to 6 decimal places -Bug fixes and stability improvements
- v9.09mo ago
-Bug fixes and stability improvements
SPL Graph — FAQ
How much money does SPL Graph make?
According to AppCurrents estimates, SPL Graph generates approximately $6–$90 per month (medium confidence), modeled from its the App Store chart performance, rating velocity, and monetization signals.
How many downloads does SPL Graph get?
SPL Graph sees an estimated 2–6 downloads per month on the App Store, per AppCurrents modeling.
Is SPL Graph free?
SPL Graph is a paid app priced at $9.99 on the App Store.
What is SPL Graph's rating?
SPL Graph holds a 3.67-star average from 3 ratings on the App Store.
When was SPL Graph released?
SPL Graph launched on the App Store on 27.03.2009. Its latest version shipped 16.09.2026.


