
Red Tide Map generates an estimated $3–$60/month in revenue from 1–4 downloads/month on the App Store, according to AppCurrents estimates (updated 2026-10-02).
| Est. revenue / month | $3–$60 |
|---|---|
| Est. downloads / month | 1–4 |
| Estimate confidence | medium |
| Pricing | Paid $8.99 |
| Rating | 3.00 ★ (2 ratings) |
| Category | Weather |
| Released | 11.02.2022 |
| App last updated | 05.09.2026 |
| Platform | iOS |
Modeled monthly estimate · rating velocity · medium confidence




About
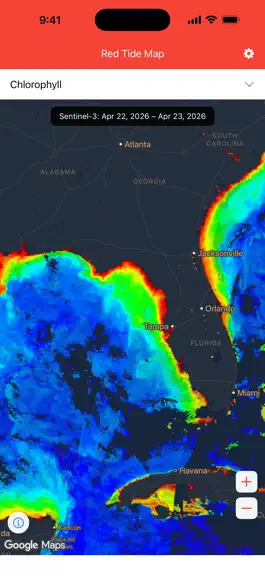
Get a map with recent red tide (harmful algal bloom) measurements for Florida coastal areas. No registration or login required. Data source: NOAA National Coastal Data Development Center Measurements are derived from field samples that are individually collected. Tap "update" in the app to get the most recent data available from NOAA. The current version of this app covers the state of Florida…
Trends & analysis
Chart rank trend
US · overallWhy it's surfacing
Scout 12Ratings & velocity
★ 0 in windowRating distribution
50% positive · 2 ratingsGeographic reach
best rank · 0 storefrontsRevenue & downloads trend
ARPU $7Update history
4 updates tracked- v2.2.027d ago
Behind-the-scenes changes to keep things running smoothly.
- v2.1.11mo ago
Behind-the-scenes changes to keep things running smoothly.
- v2.1.03mo ago
Behind-the-scenes changes to keep things running smoothly.
- v2.0.14mo ago
Behind-the-scenes changes to keep things running smoothly.
Red Tide Map — FAQ
How much money does Red Tide Map make?
According to AppCurrents estimates, Red Tide Map generates approximately $3–$60 per month (medium confidence), modeled from its the App Store chart performance, rating velocity, and monetization signals.
How many downloads does Red Tide Map get?
Red Tide Map sees an estimated 1–4 downloads per month on the App Store, per AppCurrents modeling.
Is Red Tide Map free?
Red Tide Map is a paid app priced at $8.99 on the App Store.
What is Red Tide Map's rating?
Red Tide Map holds a 3.00-star average from 2 ratings on the App Store.
When was Red Tide Map released?
Red Tide Map launched on the App Store on 11.02.2022. Its latest version shipped 05.09.2026.
Apps like Red Tide Map
See all alternatives → WeatherBug EliteWeather · $270k–$4.4M/mo
 The Weather Channel - RadarWeather · $78k–$490k/mo
 Clime: NOAA Weather Radar LiveWeather · $78k–$490k/mo
 Windy.app — Wind, Tides, RadarWeather · $78k–$490k/mo
 AccuWeather: Weather ForecastWeather · $78k–$490k/mo
 DeerCast-Prep. Predict. PursueWeather · $78k–$490k/mo