
Rad Onc Tables
Rad Onc Tables generates an estimated $40–$700/month in revenue from 10–50 downloads/month on the App Store, according to AppCurrents estimates (updated 2026-08-02).
| Est. revenue / month | $40–$700 |
|---|---|
| Est. downloads / month | 10–50 |
| Estimate confidence | medium |
| Pricing | Paid $9.99 |
| Rating | 4.96 ★ (23 ratings) |
| Category | Medical |
| Best chart rank | #92 Medical Paid |
| Released | 08.09.2018 |
| App last updated | 03.02.2026 |
| Platform | iOS |
Modeled monthly estimate · rating velocity · medium confidence




About
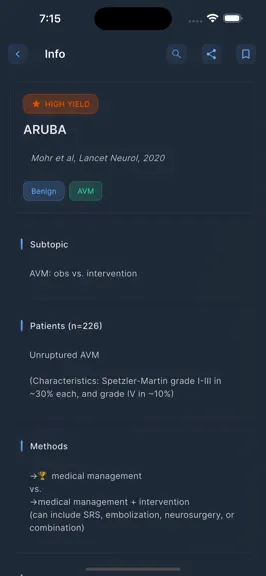
A quick reference tool for finding, summarizing, and linking directly to research related to radiation oncology.
Trends & analysis
Chart rank trend
US · categoryWhy it's surfacing
Scout 14Ratings & velocity
★ 0 in windowRating distribution
100% positive · 23 ratingsGeographic reach
best rank · 8 storefrontsRevenue & downloads trend
ARPU $7Update history
1 update tracked- v4.0.26mo ago
Minor bug fixes
Rad Onc Tables — FAQ
How much money does Rad Onc Tables make?
According to AppCurrents estimates, Rad Onc Tables generates approximately $40–$700 per month (medium confidence), modeled from its the App Store chart performance, rating velocity, and monetization signals.
How many downloads does Rad Onc Tables get?
Rad Onc Tables sees an estimated 10–50 downloads per month on the App Store, per AppCurrents modeling.
Is Rad Onc Tables free?
Rad Onc Tables is a paid app priced at $9.99 on the App Store.
What is Rad Onc Tables's rating?
Rad Onc Tables holds a 4.96-star average from 23 ratings on the App Store. It currently ranks #92 on the Medical paid chart.
When was Rad Onc Tables released?
Rad Onc Tables launched on the App Store on 08.09.2018. Its latest version shipped 03.02.2026.


