miSales Developer Sales Charts
miSales Developer Sales Charts generates an estimated $1–$6/month in revenue from 3–20 downloads/month on the App Store, according to AppCurrents estimates (updated 2026-07-26).
| Est. revenue / month | $1–$6 |
|---|---|
| Est. downloads / month | 3–20 |
| Estimate confidence | low |
| Pricing | Free + IAP |
| Rating | 5.00 ★ (1 ratings) |
| Category | Developer Tools |
| Released | 05.12.2025 |
| App last updated | 17.06.2026 |
| Platform | iOS |
Modeled monthly estimate · rating velocity · low confidence
About
“miSales Developer Sales Charts” is a focused dashboard for iOS, macOS, and visionOS developers who want a clear, trustworthy view of their App Store performance without handing data to a third‑party service. Connect your App Store Connect API credentials once and miSales pulls your reports directly from Apple, then stores and computes everything locally on your device utilizing the local Keychai…
Trends & analysis
Chart rank trend
US · overallWhy it's surfacing
Scout 15Ratings & velocity
★ 0 in windowRating distribution
100% positive · 1 ratingsGeographic reach
best rank · 0 storefrontsRevenue & downloads trend
ARPU $0In-app purchases
3 tiersUpdate history
2 updates tracked- v1.3.11mo ago
V1.3.1 Resolves issue with data not showing up soon after the latest data arrives
- v1.33mo ago
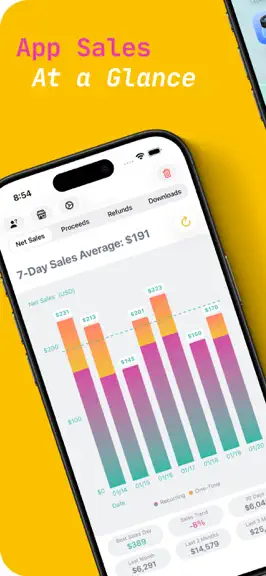
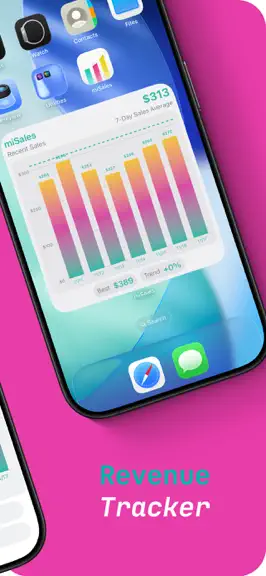
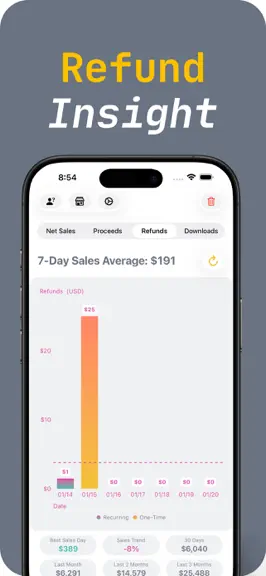
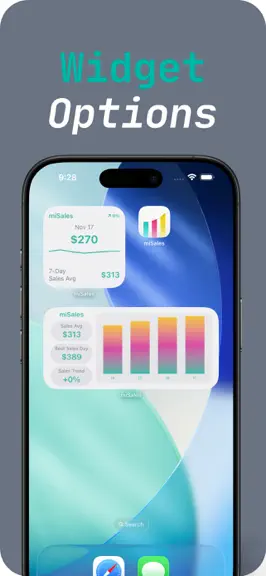
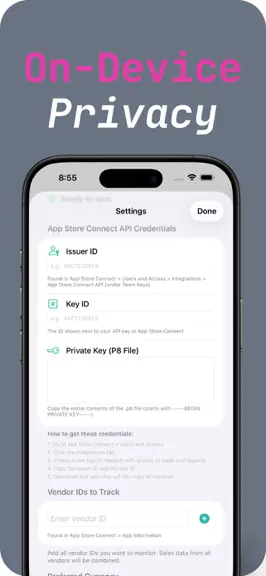
miSales gives indie developers and small teams a clear view of their App Store revenue — across iOS, macOS, and visionOS. Connect your App Store Connect API key and see daily sales, proceeds, refunds, and downloads in interactive charts. Tap any bar to reveal a per-app breakdown showing exactly which apps drove that day's numbers, with recurring vs one-time revenue detail. PRO ANALYTICS (beta) - Health Dashboard — Monitor the crash rates of your apps as well as the session counts over various time intervals - Acquisition Funnel — Impressions to product page views to downloads, with conversion rates at each stage - Territory Breakdown — Geographic revenue and download distribution ranked by market FEATURES - Multi-currency support with automatic conversion - Home screen widgets for at-a-glance monitoring - Revenue forecasting with confidence intervals - Smart alerts for significant revenue changes - CSV and chart image export - Background refresh to keep data current - Demo mode to explore without credentials PRIVACY & SECURITY Your App Store Connect private key is stored in the Keychain and loaded on-demand only during API calls. No data leaves your device except direct communication with Apple's APIs. No analytics, no tracking, no third-party servers. REQUIREMENTS An App Store Connect API key with Sales Reports access. For subscription and acquisition analytics, the Analytics Reports role is also needed — the app guides you through setup if it's missing. Runs on iPhone, iPad, Mac, and Apple Vision Pro.
miSales Developer Sales Charts — FAQ
How much money does miSales Developer Sales Charts make?
According to AppCurrents estimates, miSales Developer Sales Charts generates approximately $1–$6 per month (low confidence), modeled from its the App Store chart performance, rating velocity, and monetization signals.
How many downloads does miSales Developer Sales Charts get?
miSales Developer Sales Charts sees an estimated 3–20 downloads per month on the App Store, per AppCurrents modeling.
Is miSales Developer Sales Charts free?
miSales Developer Sales Charts is free to download on the App Store, monetizing through in-app purchases.
What is miSales Developer Sales Charts's rating?
miSales Developer Sales Charts holds a 5.00-star average from 1 ratings on the App Store.
When was miSales Developer Sales Charts released?
miSales Developer Sales Charts launched on the App Store on 05.12.2025. Its latest version shipped 17.06.2026.


