
HVAC PT Chart
HVAC PT Chart generates an estimated $6–$30/month in revenue from 4–20 downloads/month on the App Store, according to AppCurrents estimates (updated 2026-06-18).
| Est. revenue / month | $6–$30 |
|---|---|
| Est. downloads / month | 4–20 |
| Estimate confidence | medium |
| Pricing | Free + IAP |
| Rating | 4.00 ★ (8 ratings) |
| Category | Productivity |
| Released | 13.03.2012 |
| App last updated | 19.02.2023 |
| Platform | iOS |
Modeled monthly estimate · rating velocity · medium confidence
About
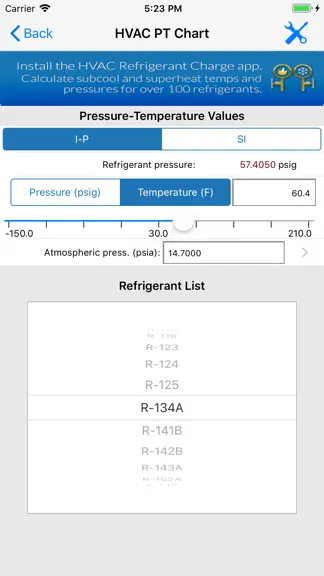
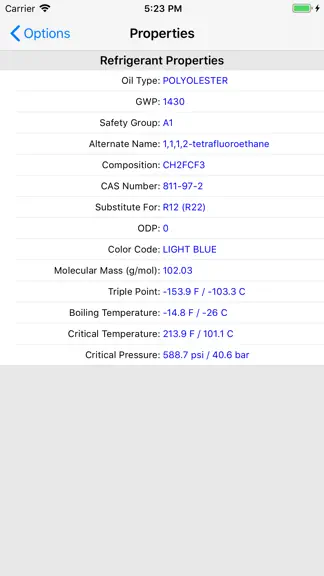
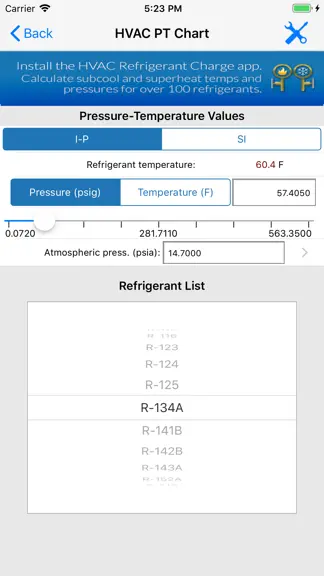
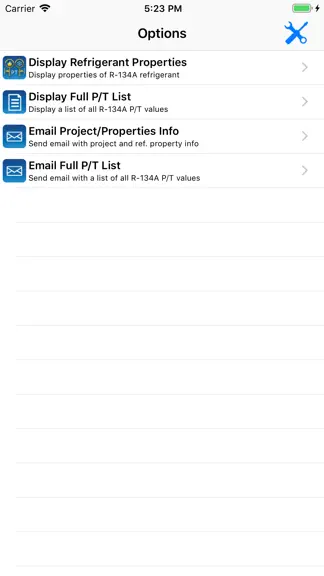
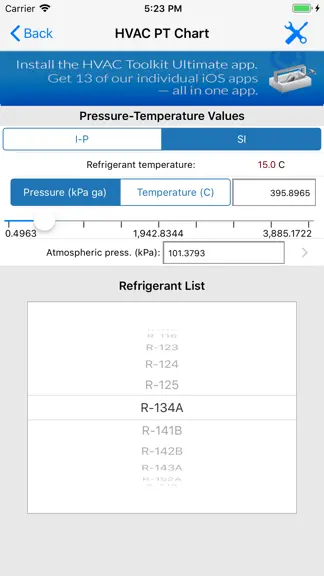
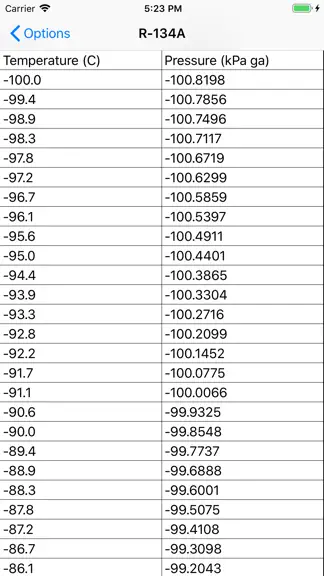
HVAC PT Chart is an electronic pressure temperature calculator that allows HVAC technicians and contractors to quickly look up the temperature and corresponding pressure for 100+ common HVAC refrigerants including both bubble and dew versions of azeotropic (mixture) refrigerants. This is the only PT Chart app that allows you to email complete PT chart lists, refrigerant properties, and your inputt…
Trends & analysis
Chart rank trend
US · overallWhy it's surfacing
Scout 6Ratings & velocity
Rating distribution
63% positive · 8 ratingsGeographic reach
best rank · 0 storefrontsRevenue & downloads trend
ARPU $1In-app purchases
1 tiersUpdate history
1 update tracked- v5.43.3y ago
Added new low GWP refrigerant: R-454B and R-454B (Dew)
HVAC PT Chart — FAQ
How much money does HVAC PT Chart make?
According to AppCurrents estimates, HVAC PT Chart generates approximately $6–$30 per month (medium confidence), modeled from its the App Store chart performance, rating velocity, and monetization signals.
How many downloads does HVAC PT Chart get?
HVAC PT Chart sees an estimated 4–20 downloads per month on the App Store, per AppCurrents modeling.
Is HVAC PT Chart free?
HVAC PT Chart is free to download on the App Store, monetizing through in-app purchases.
What is HVAC PT Chart's rating?
HVAC PT Chart holds a 4.00-star average from 8 ratings on the App Store.
When was HVAC PT Chart released?
HVAC PT Chart launched on the App Store on 13.03.2012. Its latest version shipped 19.02.2023.