High Tide - Charts and Graphs
High Tide - Charts and Graphs generates an estimated $200–$1k/month in revenue from 300–2k downloads/month on the App Store, according to AppCurrents estimates (updated 2026-06-11).
| Est. revenue / month | $200–$1k |
|---|---|
| Est. downloads / month | 300–2k |
| Estimate confidence | medium |
| Pricing | Paid $0.99 |
| Rating | 3.83 ★ (223 ratings) |
| Category | Weather |
| Best chart rank | #51 Weather Paid |
| Released | 30.01.2017 |
| App last updated | 11.02.2021 |
| Platform | iOS |
Modeled monthly estimate · medium confidence
About
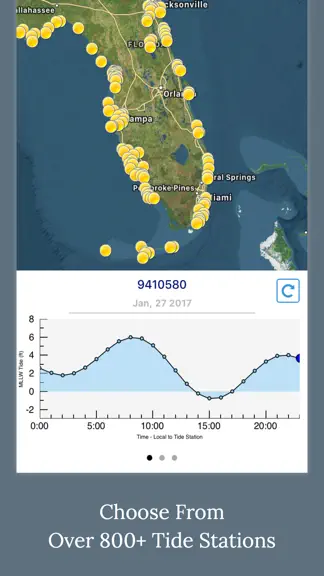
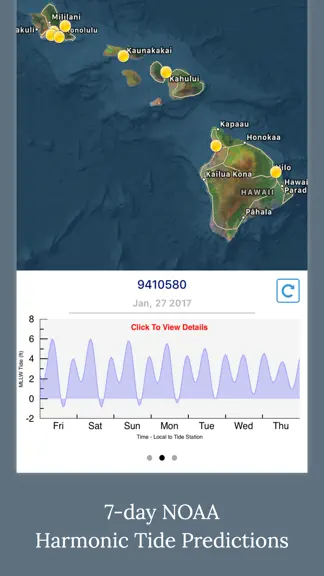
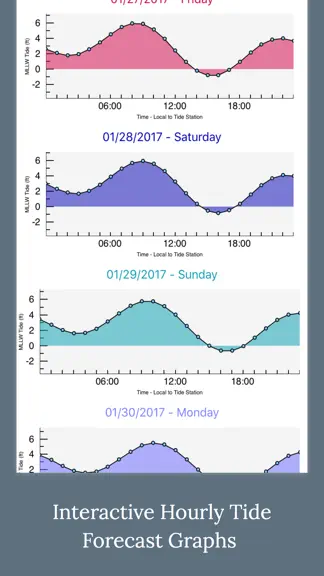
** A Simple, Elegant Tide Forecast Tool ** Features include: * Quickly view current and forecasted tide data * 7-day, hourly NOAA tide forecast * Interactive tide graphs * Automatically saves your preferences to the cloud * Choose from over 800+ tide stations ** Available for iPad and iPhone with single purchase** Feel free to contact me for feature requests. Enjoy.
Trends & analysis
Chart rank trend
US · categoryWhy it's surfacing
Scout 16Reviews & velocity
Rating distribution
70% positive · 223 ratingsGeographic reach
best rank · 1 storefrontRevenue & downloads trend
ARPU $1Update history
1 update tracked- v1.0.85.3y ago
- Fixed a few minor bugs Thank you for the positive feedback!
High Tide - Charts and Graphs — FAQ
How much money does High Tide - Charts and Graphs make?
According to AppCurrents estimates, High Tide - Charts and Graphs generates approximately $200–$1k per month (medium confidence), modeled from its the App Store chart performance, rating velocity, and monetization signals.
How many downloads does High Tide - Charts and Graphs get?
High Tide - Charts and Graphs sees an estimated 300–2k downloads per month on the App Store, per AppCurrents modeling.
Is High Tide - Charts and Graphs free?
High Tide - Charts and Graphs is a paid app priced at $0.99 on the App Store.
What is High Tide - Charts and Graphs's rating?
High Tide - Charts and Graphs holds a 3.83-star average from 223 ratings on the App Store. It currently ranks #51 on the Weather paid chart.
When was High Tide - Charts and Graphs released?
High Tide - Charts and Graphs launched on the App Store on 30.01.2017. Its latest version shipped 11.02.2021.