
ChartLogs generates an estimated $0/month in revenue from 0 downloads/month on the App Store, according to AppCurrents estimates (updated 2026-10-02).
| Est. revenue / month | $0 |
|---|---|
| Est. downloads / month | 0 |
| Estimate confidence | low |
| Pricing | Free |
| Rating | 0.00 ★ (0 ratings) |
| Category | Finance |
| Released | 28.10.2025 |
| App last updated | 20.02.2026 |
| Platform | iOS |
Modeled monthly estimate · rating velocity · low confidence

About
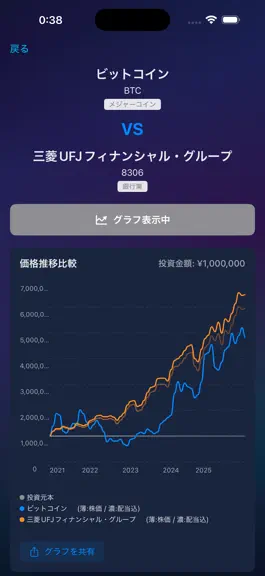
How much would your money have grown if you had invested in the past? ChartLogs is a simulation app that lets you explore the last 10 years of price performance for stocks, ETFs, crypto, FX, and commodities. For example: “If I had invested ¥1,000,000 in Bitcoin and the S&P 500 five years ago, which one would have grown more? What if dividends were included?” ChartLogs helps you compare results in…
Trends & analysis
Chart rank trend
US · overallWhy it's surfacing
Scout 14Ratings & velocity
Geographic reach
best rank · 0 storefrontsRevenue & downloads trend
monthly estimateUpdate history
1 update tracked- v2.0.07mo ago
- Added support for recurring (monthly) investing - Added partial support for English and Chinese
ChartLogs — FAQ
How many downloads does ChartLogs get?
ChartLogs sees an estimated 0 downloads per month on the App Store, per AppCurrents modeling.
Is ChartLogs free?
ChartLogs is free to download on the App Store, with no in-app purchases detected.
When was ChartLogs released?
ChartLogs launched on the App Store on 28.10.2025. Its latest version shipped 20.02.2026.
Apps like ChartLogs
See all alternatives → Experian®Finance · $270k–$1.5M/mo
 Rocket Money - Bills & BudgetsFinance · $180k–$970k/mo
 TradingView: Track All MarketsFinance · $160k–$880k/mo
 MileIQ: Mileage Tracker & LogFinance · $120k–$680k/mo
 Lenme: Borrowing and LendingFinance · $100k–$570k/mo
 Build Credit & Money: Dovly AIFinance · $100k–$550k/mo