
Charting - Plotter
Charting - Plotter generates an estimated $6–$40/month in revenue from 10–50 downloads/month on the App Store, according to AppCurrents estimates (updated 2026-08-02).
| Est. revenue / month | $6–$40 |
|---|---|
| Est. downloads / month | 10–50 |
| Estimate confidence | low |
| Pricing | Free + IAP |
| Rating | 3.39 ★ (23 ratings) |
| Category | Productivity |
| Released | 26.10.2017 |
| App last updated | 12.09.2022 |
| Platform | iOS |
Modeled monthly estimate · rating velocity · low confidence
About
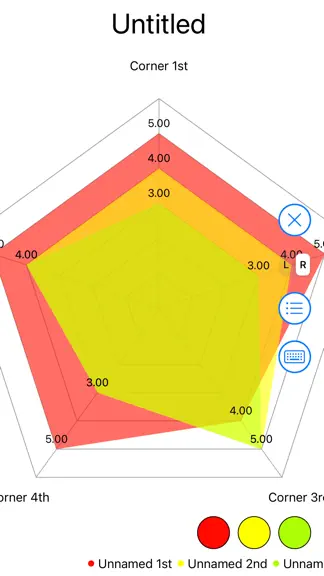
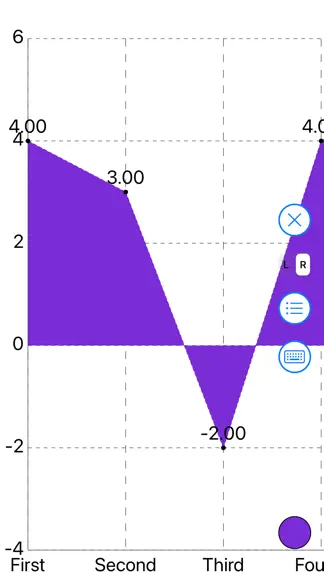
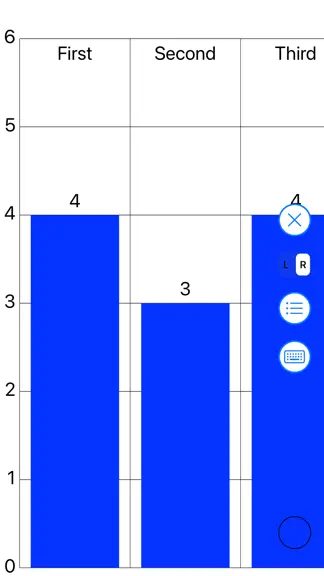
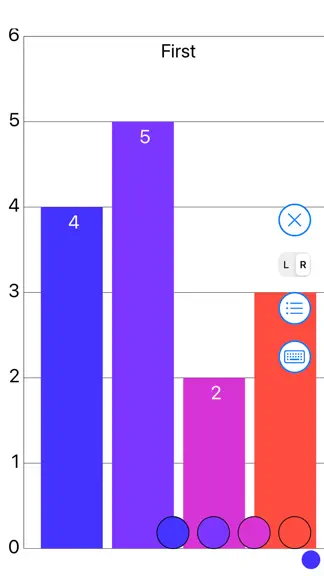
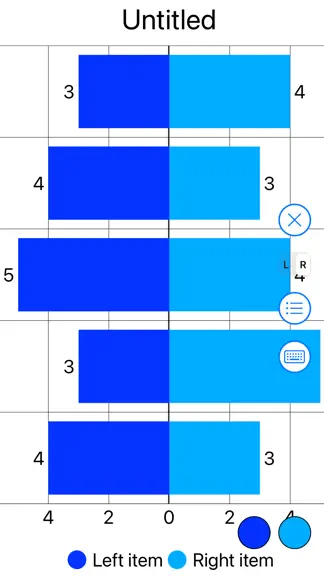
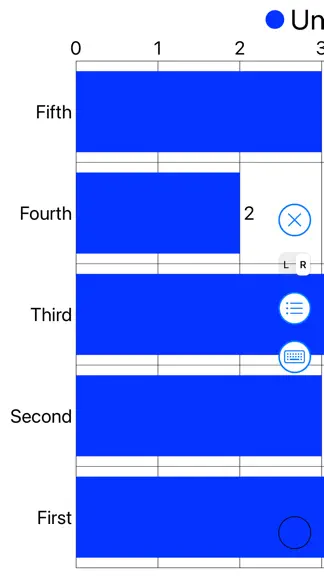
Simple and easy operation interface. Draw charts easily and quickly anytime, anywhere. Usage: Please watch the app preview. Note: 1.Support iCloud sync. 2.Export Plotter format files to share data with other users.
Trends & analysis
Chart rank trend
US · overallWhy it's surfacing
Scout 7Ratings & velocity
★ 0 in windowRating distribution
57% positive · 23 ratingsGeographic reach
best rank · 0 storefrontsRevenue & downloads trend
ARPU $1In-app purchases
1 tiersUpdate history
1 update tracked- v5.73.9y ago
Repair iCloud
Charting - Plotter — FAQ
How much money does Charting - Plotter make?
According to AppCurrents estimates, Charting - Plotter generates approximately $6–$40 per month (low confidence), modeled from its the App Store chart performance, rating velocity, and monetization signals.
How many downloads does Charting - Plotter get?
Charting - Plotter sees an estimated 10–50 downloads per month on the App Store, per AppCurrents modeling.
Is Charting - Plotter free?
Charting - Plotter is free to download on the App Store, monetizing through in-app purchases.
What is Charting - Plotter's rating?
Charting - Plotter holds a 3.39-star average from 23 ratings on the App Store.
When was Charting - Plotter released?
Charting - Plotter launched on the App Store on 26.10.2017. Its latest version shipped 12.09.2022.


