
BassMap: Acoustic Visualizer
BassMap: Acoustic Visualizer generates an estimated $500–$9k/month in revenue from 300–1k downloads/month on the App Store, according to AppCurrents estimates (updated 2026-10-02).
| Est. revenue / month | $500–$9k |
|---|---|
| Est. downloads / month | 300–1k |
| Estimate confidence | medium |
| Pricing | Paid $4.99 |
| Rating | 0.00 ★ (0 ratings) |
| Category | Entertainment |
| Best chart rank | #84 Entertainment Paid |
| Released | 08.09.2026 |
| App last updated | 30.09.2026 |
| Platform | iOS |
Modeled monthly estimate · rating velocity · medium confidence
About
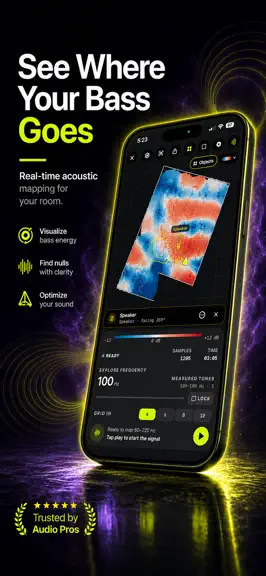
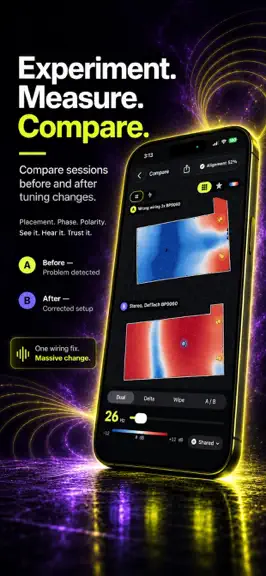
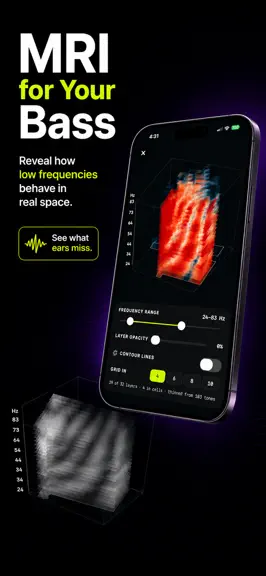
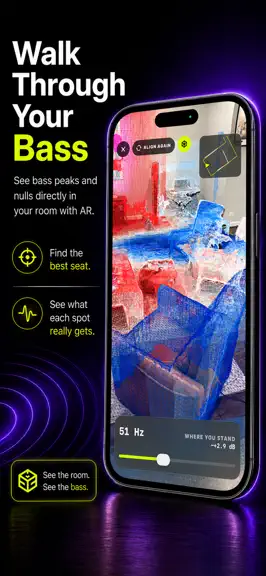
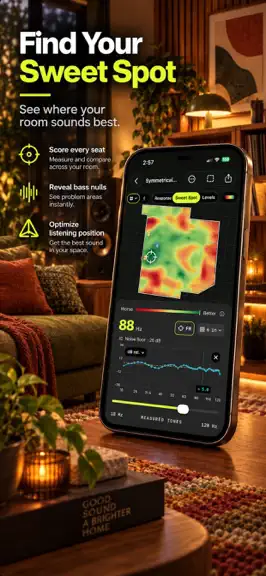
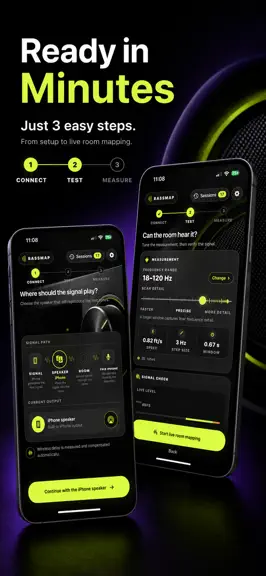
BassMap turns your home theater into an acoustic masterpiece. Walk around with your iPhone and build a spatial heatmap that reveals bass peaks, nulls, standing waves, and dead zones. Move your subwoofer. Change your listening position. Adjust EQ or crossover settings. Measure again and compare. Use BassMap to optimize your setup, dial in subwoofer placement, find ideal listening spots, and see e…
Trends & analysis
Chart rank trend
US · categoryWhy it's surfacing
Scout 50Ratings & velocity
★ 0 in windowGeographic reach
best rank · 1 storefrontRevenue & downloads trend
ARPU $3Update history
3 updates tracked- v1.2.02d ago
**Levels View** — visualize how sound level varies across the room **Automatic Room Geometry Correction** — after a measurement, BassMap automatically adjusts the geometry to better match the actual space.
- v1.1.03d ago
- **Sweet Spot Map** — see how balanced the sound is throughout the room and find the best listening spots. - **Frequency response at any point** — tap anywhere on the heatmap to see the response graph for that location. - **Multiple language support**
- v1.0.114d ago
* **Significantly faster heatmap rendering** for quicker updates and smoother interaction. * **Enhanced sharing controls** with precise frame selection, rotation, zoom, and heatmap scaling for better composition. * **Improved room detection stability and accuracy** with more consistent room geometry.
BassMap: Acoustic Visualizer — FAQ
How much money does BassMap: Acoustic Visualizer make?
According to AppCurrents estimates, BassMap: Acoustic Visualizer generates approximately $500–$9k per month (medium confidence), modeled from its the App Store chart performance, rating velocity, and monetization signals.
How many downloads does BassMap: Acoustic Visualizer get?
BassMap: Acoustic Visualizer sees an estimated 300–1k downloads per month on the App Store, per AppCurrents modeling.
Is BassMap: Acoustic Visualizer free?
BassMap: Acoustic Visualizer is a paid app priced at $4.99 on the App Store.
When was BassMap: Acoustic Visualizer released?
BassMap: Acoustic Visualizer launched on the App Store on 08.09.2026. Its latest version shipped 30.09.2026.


