
Basketball Analytics
Basketball Analytics generates an estimated $2–$8/month in revenue from 1–4 downloads/month on the App Store, according to AppCurrents estimates (updated 2026-06-17).
| Est. revenue / month | $2–$8 |
|---|---|
| Est. downloads / month | 1–4 |
| Estimate confidence | medium |
| Pricing | Paid $2.99 |
| Rating | 5.00 ★ (1 ratings) |
| Category | Sports |
| Released | 10.03.2024 |
| App last updated | 27.01.2026 |
| Platform | iOS |
Modeled monthly estimate · rating velocity · medium confidence


About
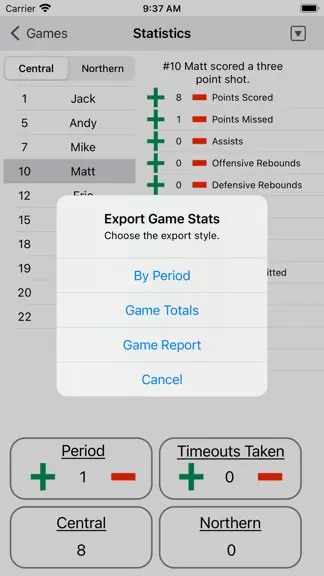
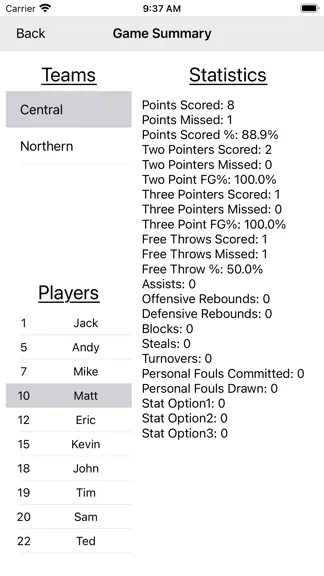
Track the following basketball statistics for each period of the game: Points Scored, Points Missed, Assists, Offensive Rebounds, Defensive Rebounds, Blocks, Steals, Turnovers, Fouls Committed, Fouls Drawn, and three statistics of the user's choosing for all players. The game and season summaries also display the following statistics for each player: Points Scored %, Foul Shot %, Two Point FG %…
Trends & analysis
Chart rank trend
US · overallWhy it's surfacing
Scout 12Ratings & velocity
Rating distribution
100% positive · 1 ratingsGeographic reach
best rank · 0 storefrontsRevenue & downloads trend
ARPU $2Update history
1 update tracked- v1.044mo ago
-Support for large and bold font
Basketball Analytics — FAQ
How much money does Basketball Analytics make?
According to AppCurrents estimates, Basketball Analytics generates approximately $2–$8 per month (medium confidence), modeled from its the App Store chart performance, rating velocity, and monetization signals.
How many downloads does Basketball Analytics get?
Basketball Analytics sees an estimated 1–4 downloads per month on the App Store, per AppCurrents modeling.
Is Basketball Analytics free?
Basketball Analytics is a paid app priced at $2.99 on the App Store.
What is Basketball Analytics's rating?
Basketball Analytics holds a 5.00-star average from 1 ratings on the App Store.
When was Basketball Analytics released?
Basketball Analytics launched on the App Store on 10.03.2024. Its latest version shipped 27.01.2026.