
Spotter Tools Pro: Storm Radar
Spotter Tools Pro: Storm Radar generates an estimated $2k–$29k/month in revenue from 200–1k downloads/month on the App Store, according to AppCurrents estimates (updated 2026-10-02).
| Est. revenue / month | $2k–$29k |
|---|---|
| Est. downloads / month | 200–1k |
| Estimate confidence | medium |
| Pricing | Paid $19.99 |
| Rating | 5.00 ★ (6 ratings) |
| Category | Weather |
| Best chart rank | #12 Weather Paid |
| Released | 06.06.2026 |
| App last updated | 28.09.2026 |
| Platform | iOS |
Modeled monthly estimate · rating velocity · medium confidence

About
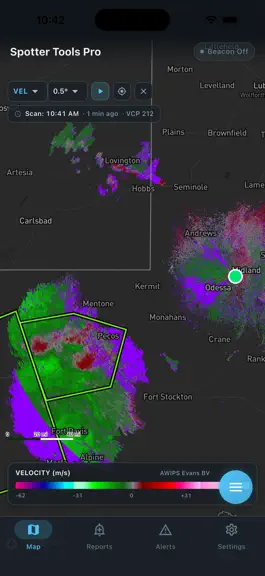
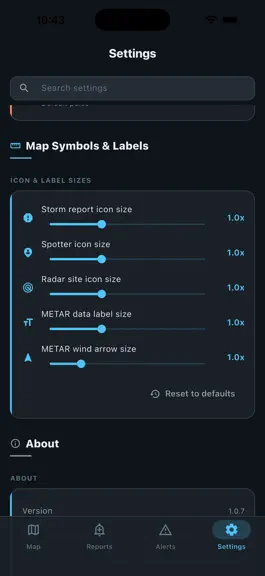
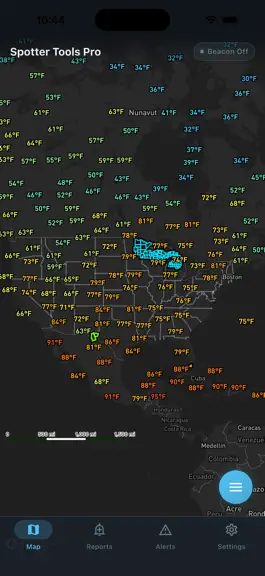
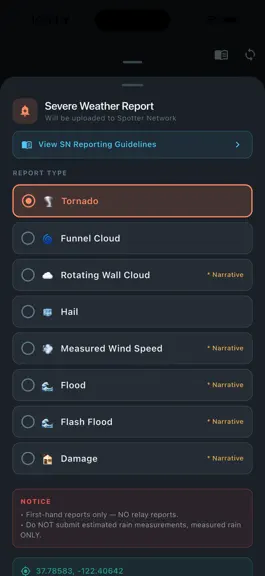
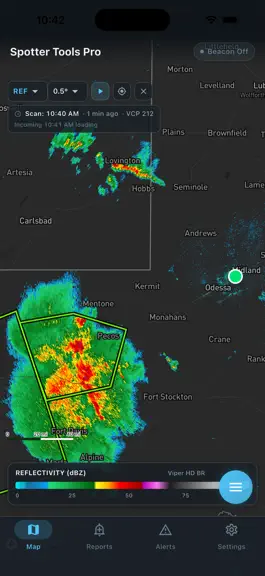
Spotter Tools Pro is a severe weather app for weather enthusiasts, storm chasers, and trained spotters. GPU-rendered NEXRAD radar, live wind flow, soundings, lightning, satellite, worldwide tropical, air quality, five forecast models, IBW alerts, live chasers, and thousands of live cameras. Spotters and chasers also get Spotter Network reporting, a GPS beacon, Chaser Mode, and opt-in Presence. Buy…
Trends & analysis
Chart rank trend
US · categoryWhy it's surfacing
Scout 33Ratings & velocity
★ +5 in windowGeographic reach
best rank · 1 storefrontRevenue & downloads trend
ARPU $14Update history
12+ updates tracked- v1.0.714d ago
One of our biggest updates yet. Four new tools, and a lot of polish. TORNADO ID (EXPERIMENTAL) A new option for single site radar that marks circulations with the chance a tornado is on the ground right now. • Built from years of Level 2 radar and confirmed tornado reports, and tested on a full year of storms it never saw • Tap a marker for its score, whether it is rising or falling, how long it has been tracked and whether a debris signature is showing • Works on live radar and in archive mode, where your device scores the scan itself • Off by default. Open Map layers, tap Single Site Radar and switch on Tornado ID • It is an estimate. Always follow official warnings EXPERT MODE Radar holes are real. One radar may be looking at the top of a storm while a neighbouring radar sees much lower over the same ground. • Turn on Expert on the radar panel, then tap up to two more radar sites on the map • Each radar paints only the ground it is closest to, so there is no double counting and the picture stays true single site data • All radars line up to the same moment, and a radar that is down is left out • Numbered badges show which radars are in the image PRECIP TYPE A new single site product that colors the radar as rain, snow, sleet or freezing rain. • Intensity comes from the radar, the type comes from the HRRR model, updated every 15 minutes • The inspector reads the type at any spot • Works in loops, with each frame colored from its own time MORE OUTLOOKS THAN EVER • Winter Weather: chance of 4, 8 and 12 inches of snow and a quarter inch of ice, Days 1 to 3 • WPC Hazards Days 3 to 7 and CPC Hazards Days 8 to 14, including heat, drought and flooding • Fire Weather out to Day 8 • Rainfall for Days 4 to 7 and in 6 hour periods • Winter Storm Severity parts: snow amount, snow load, ice and blowing snow • Monthly and seasonal temperature, precipitation and drought outlooks • Outlooks now load from our own fast servers, with NOAA as a backup RADAR IMPROVEMENTS • Level 2 velocity is cleaner, with far fewer folded patches that look like fake couplets • The Reflectivity filter now also cleans up the national radar mosaic • Velocity loops no longer get stuck on one frame on days when the radar changes scan modes • Archive loops now wait on the first frame until you press Play, and returning to live closes the loop • Archive radar no longer shows the wrong day after a network hiccup ALSO NEW • Live Cameras filter: show All, Live video or Stills only, with a count of what is on the map • Hurricane Hunter flights export as a two page picture brief or as data files • Soundings open on the hour closest to now instead of hours ago • The Tropical options sheet scrolls, so the storm list is always reachable • Map layer lists are back in alphabetical order
- v1.0.7014d ago
RADAR STARTS FASTER This release is mostly about the app getting out of its own way. • Archive loops build about a third faster and start playing sooner • A loop frame downloads only the part of the file it needs, and unpacks only the tilt it paints, instead of the whole scan • Six core phones get a second decode worker rather than grinding through a loop on one • Phones with memory to spare keep more of the loop. The budget used to be one flat number, so a large phone would thin a two hour loop down to thirteen frames with gigabytes going spare • Opening a site paints the real radar sooner. The first image was often a Level III picture up to a minute older than the Level 2 data already waiting STORMS IN 3D, BUILT FOR YOU The 3D storm volume arrived last release and your device had to build it. Now our servers build it and send it down ready to draw. • It appears almost immediately rather than after a full local scan. If no prepared volume is available for your site, the app quietly builds it locally as before • Your radar site and the national mosaic have their own opacity sliders, so you can keep the mosaic sheer for context and your own radar solid • Less banding inside the volume, so a storm reads as a solid body rather than a stack of shells • Debris and rotation still need the local scan, so on a fresh site the storm can appear before its highlights SPC OUTLOOK ALERTS ARE ABOUT YOU Outlook notifications were firing on the highest risk anywhere in the country, so a moderate risk in Nebraska sent a Tennessee user a banner quoting Nebraska's numbers, and tapping it showed no outlook on the map. • Outlooks are now matched against your own watch zones, and the alert describes the risk over each of them • Tapping one turns the outlook layer on and flies you to the strongest zone • A nationwide watch zone no longer means the whole country for outlooks. Warnings are unchanged, and there is a setting if you want the old behaviour • Outlooks that already expired no longer arrive after a background restart THE MAP TURNS WHEN YOU MEAN IT Two finger twist arrived last release and fired too easily, so a pinch with a wobble in it left the map slightly turned. • A turn now takes a deliberate twist, and nothing jumps when it engages • Lifting one finger can no longer turn a zoom into a rotation • There is a lock button if you would rather it never turned. The detent at north is unchanged and Chaser Mode still locks north up FORECAST • Every period carries its date, on the rail cards and in the list • Wind is on the cards, with a rising or falling temperature arrow when the office flags one • Rain chance is always drawn, so a dry day between wet ones reads as 0% • The hourly strip labels the day at the start and at every midnight FIXES • The map could freeze with cameras on. Drawing thousands of cameras shared a thread with the interface; it now happens off to the side and pauses in the background • Four sliders could paint a red error panel over the settings section they were in • Radar could stick after switching products with two views open, or leave a worker running after you left the screen • A first launch with no location permission and no home set opened on the middle of the ocean, and now opens on the country
- v1.0.6920d ago
STORMS IN 3D Radar has always been a flat slice. Now you can stand the whole scan up as a solid and fly around it, so you can see how a storm is built rather than inferring it one tilt at a time. Two ways in, following the layer you are on: • Your radar site's own volume, every tilt of a Level 2 scan resampled into one block, for a single storm in full detail • The nationwide mosaic, which works anywhere in the lower 48 at about a two minute cadence, so you are not tied to one radar's umbrella What you can see in it: • Debris and rotation are marked inside the storm. Debris shows where the radar sees something that is not rain, and rotation shows as a column through the storm rather than a couplet you have to hunt for on one tilt • Cores show through the envelope. Opacity follows rain rate, so heavy cores stay solid while light rain goes sheer and you can see into a storm from any side • Height is yours to set, including true scale • It plays. The volume runs with the loop, so you can watch a storm build and collapse in three dimensions The 3D chip appears when your device can render it, so it will not be on every phone. It always starts off when you open the app, on purpose, so you never get a pitched 3D map and a heavy load you did not ask for. It renders at whatever resolution keeps your device smooth, dropping detail before it drops frames. THE MAP TURNS Turning the map used to be Chaser Mode only. Now twist with two fingers anywhere to turn it; tilt is still the two finger vertical drag it always was. There is a detent at north. Come back within a few degrees and the map snaps to exactly north and stays there, so a twist that was really a pinch cannot leave you sitting three degrees off. Turning away takes a deliberate push, and the turn you put in while it was held is paid back in one motion rather than thrown away. Chaser Mode still locks north up, because it re-centres on every fix and a turnable map there would fight you the whole drive. LIGHTER ON MEMORY The satellite layer was the heaviest thing in the app, and four separate places were holding full resolution imagery with nothing on screen to show it. All four now let go. If you run satellite alongside radar the app has far more headroom than it did. FIXES • The 3D chips no longer come back on by themselves. They shared saved settings with the shape controls, so a session that ended in 3D handed the next launch a pitched 3D map at cold start. Height and floor choices are still remembered • Turning on 3D from a Level III product now switches you to the Level 2 twin of what you were looking at, since a volume needs the full scan • Exported loops carry the 3D volume, so what you share is what you saw • On iPad, the mosaic volume repainted slowly and now keeps up
- v1.0.6823d ago
Crash fix improvements.
- v1.0.6724d ago
INSTANT LEVEL 2 RADAR, NOW FOR SIX PRODUCTS Pre-decoded Level 2 frames arrive ready to draw instead of being decoded on your device. That used to cover reflectivity and velocity. It now covers six: • Reflectivity and velocity, as before • Correlation coefficient, the debris signature product • Spectrum width • Storm relative velocity and normalized rotation, both derived from the same velocity frame, so they arrive with it Switching products is fast now, not just switching sites. Going from Level III reflectivity to Level 2 velocity used to take about six seconds, because the old path structurally lacks the velocity half for most of a scan cycle and simply waited. That switch now races the fast lane. This covers the live lowest tilt. Higher tilts, every other product and the entire archive are unchanged. The fast path is an accelerator, not a requirement. Your device can still decode all of it on its own, and does exactly that whenever our radar service is busy or unreachable, with no error and nothing missing. It can only ever make things quicker, never leave you worse off. NORMALIZED ROTATION ACTUALLY WORKS It never drew anything. The completeness check asked each radar scan whether it carried a rotation measurement, which no scan does, because rotation is computed from velocity after the fact. So it waited forever for something that was never coming. If you tried it before and concluded it was unfinished, it was not. A CATEGORY 4 HURRICANE THAT DREW NOTHING Hurricane Lowell sat south of Hawaii as a Category 4 with no track, no cone and no wind field. Storms that cross 140 West get refiled by the National Hurricane Center into its Central Pacific list while keeping the basin code they were born with. Our hurricane centre feed skipped that list because the worldwide feed was supposed to own it, and the worldwide feed dropped him because he still read as an East Pacific storm. Each half deferred to the other. Fixed, along with storms being dropped when the summary list was briefly unreachable, and some storms being drawn twice. Recon flights in the East Pacific were missing too. Bulletins from that basin use a header the parser did not recognise, so those flights showed centre fixes from the eye but no flight track. Every East Pacific mission now parses. EXPORTED LOOPS LOOK MUCH BETTER The video quality formula was tuned against a tall phone screen, so wide frames computed below the minimum and went out at the lowest rate the encoder allows. Radar gate edges and palette boundaries break up badly at that rate. • Roughly three times the bitrate at the same size setting • A new XL size at 1440 pixels, since a desktop canvas is three to four times wider than the old ceiling. Your saved size preference is not disturbed MORE SATELLITE COVERAGE IN THE PACIFIC The central Pacific region now reaches 30 North, so a recurving hurricane no longer crosses an uncovered strip. The northwest Pacific region is wider, keeping the East China Sea approach and recurvature past Japan in frame. New Japan and Philippines landfall sectors. Region bounds are now server driven, so future coverage changes reach you without an update.
Spotter Tools Pro: Storm Radar — FAQ
How much money does Spotter Tools Pro: Storm Radar make?
According to AppCurrents estimates, Spotter Tools Pro: Storm Radar generates approximately $2k–$29k per month (medium confidence), modeled from its the App Store chart performance, rating velocity, and monetization signals.
How many downloads does Spotter Tools Pro: Storm Radar get?
Spotter Tools Pro: Storm Radar sees an estimated 200–1k downloads per month on the App Store, per AppCurrents modeling.
Is Spotter Tools Pro: Storm Radar free?
Spotter Tools Pro: Storm Radar is a paid app priced at $19.99 on the App Store.
What is Spotter Tools Pro: Storm Radar's rating?
Spotter Tools Pro: Storm Radar holds a 5.00-star average from 6 ratings on the App Store. It currently ranks #12 on the Weather paid chart.
When was Spotter Tools Pro: Storm Radar released?
Spotter Tools Pro: Storm Radar launched on the App Store on 06.06.2026. Its latest version shipped 28.09.2026.
Apps like Spotter Tools Pro: Storm Radar
See all alternatives → WeatherBug EliteWeather · $270k–$4.4M/mo
 The Weather Channel - RadarWeather · $78k–$490k/mo
 Clime: NOAA Weather Radar LiveWeather · $78k–$490k/mo
 MyRadar Accurate Weather RadarWeather · $78k–$490k/mo
 AccuWeather: Weather ForecastWeather · $78k–$490k/mo
 Surfline: Wave & Surf ReportsWeather · $78k–$490k/mo